We spend about 90% of our time indoors, so the air in homes, schools, and offices is relevant for comfort and health. The Indoor Air Quality Index (IAQI) turns multiple pollutant readings into a single, easy‑to‑read score so you can act quickly. This article keeps the spirit of the original Atmotube explainer while adding source‑linked guidance from public agencies for accuracy and clarity.
IAQI is a composite score that summarizes indoor air conditions in real time. It combines several pollutant‑specific sub‑indices into one number and category for quick decisions.
IAQI is not a government standard; it adapts the EPA’s well‑known ‘ratio’ method used for the outdoor Air Quality Index (AQI) to indoor conditions.
Both use pollutant breakpoints and linear interpolation to convert concentrations into index values, but the outdoor AQI reports 1–24 hour averages for ambient pollutants, while IAQI is designed for minute‑by‑minute indoor decisions.
IAQI also includes indoor‑relevant metrics like CO2 and TVOC that are not part of the EPA outdoor AQI.
In short: each pollutant is converted to an individual sub‑index using breakpoints; the final IAQI is the lowest of the sub‑indices (the most limiting pollutant). IAQI uses a 1‑minute average to capture rapid indoor changes.
This mirrors EPA’s linear interpolation for AQI, adapted for indoor pollutants.
To better understand the IAQI, let's delve into its calculation methodology.
The IAQI was developed based on the existing ratio method, which was introduced by the U.S. EPA in 2006 to calculate the outdoor air quality index (AQI). The U.S. EPA defines the national outdoor air quality standards based on the six common air pollutants, and the index was calculated using the following linear interpolation formula to convert from concentration to AQI:

To calculate the AQI, the EPA measured outdoor pollutants such as ozone (O3), particulate matter (PM10 and PM2.5), and carbon monoxide (CO) based on an hourly to 24-hour average, depending on the type of pollutant. Then, the average value for each pollutant was converted into an individual index based on the EPA’s breakpoint table.
The EPA's breakpoint table primarily focuses on outdoor air quality and might not capture rapid shifts in indoor environments. Additionally, it doesn't cover certain indoor pollutants like CO2, VOCs, and formaldehyde. For indoor spaces, it's essential to get instant updates on air quality to ensure safety and prompt action.
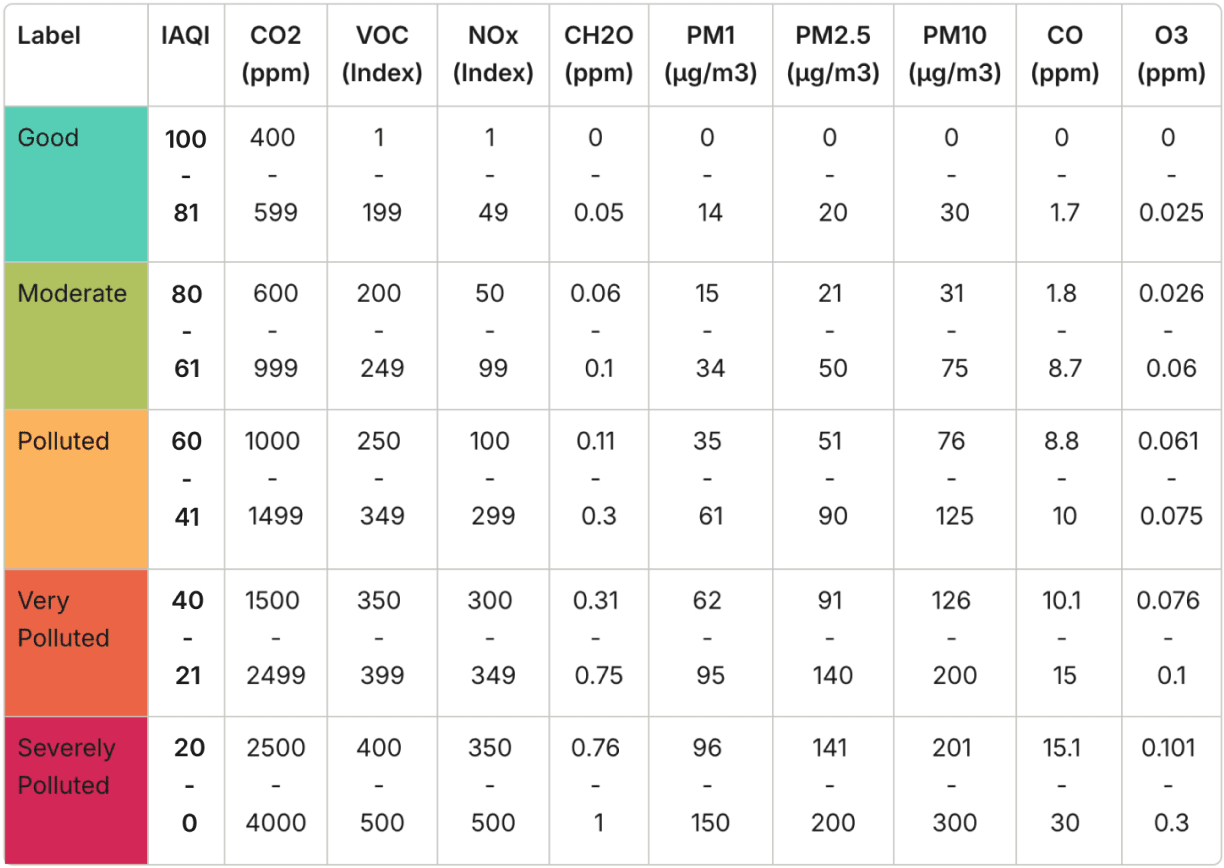
Using the same methodology, we created a breakpoint table for IAQI:
When comparing the IAQI to the EPA's AQI, there are some key differences:
Scale and Categorization: The IAQI categorizes air quality into five levels, each with its own color and range:
Contrary to the U.S. EPA's scale, a higher IAQI value means better air quality.
Time Averages for Index Calculation: The EPA determines its index based on 1- or 8-hour pollutant averages. In contrast, the IAQI uses a one-minute average to provide more immediate readings.
To determine the real-time IAQI value, the following formula is used:

Let’s say the individual index for CO2 is 81; the IAQI status for CO2 is therefore “Good”. Similarly, the index for PM2.5 is 70, or “Moderate” and for VOC, it is 60, or “Polluted”.
Each individual index is then compared, and the lowest index value becomes the final value for IAQI. Thus, the final AQI value is 60, and the status is “Polluted”.
Typical inputs include PM1/PM2.5 (optical particle counters), CO2 (NDIR), TVOC (MOS/photoionization), formaldehyde (specific sensor), plus temperature and humidity for context.
For reliable trends, look for devices with published evaluation data or third‑party testing and apply recommended correction factors where applicable.
According to the Atmotube IAQI scale, higher is better. Aim to keep occupied spaces in Good (81–100) most of the time.
For context, align pollutant levels with public‑health guidelines where possible—e.g., PM2.5 ≤ 15 µg/m³ (24‑h) and ≤ 5 µg/m³ (annual) per WHO.
The IAQI scale is split into five categories (higher = cleaner): Good (81–100), Moderate (61–80), Polluted (41–60), Very Polluted (21–40), Severely Polluted (0–20).
These categories are a quick‑read overlay; always pair them with pollutant details when taking action—especially for sensitive groups.
Watch both. IAQI gives a whole‑room picture, while CO2 is a practical proxy for ventilation adequacy in occupied spaces. Many agencies use **~1,000 ppm (24‑h)** as a residential benchmark for adequate ventilation.
High CO2 doesn’t mean pathogens are present, but it often co‑occurs with other indoor pollutants when ventilation is weak. Occupational limits remain much higher.
Choose monitors that measure PM2.5, CO2 (NDIR), and TVOC at a minimum, with clear breakpoints and a transparent IAQI/IAQ scoring method. Check independent evaluations and the EPA Air Sensor Toolbox for performance insights.
For reference, the IAQI described here is implemented in the Atmocube commercial monitor (RESET Air Grade B).
Source control first, then ventilation with clean outdoor air, then filtration. During smoke or heavy outdoor pollution, seal and filter; when air is clean, ventilate more.
Use HEPA purifiers sized by CADR, and upgrade central HVAC to MERV‑13+ if the system allows; avoid ozone‑generating devices.
Keep spaces in good condition (81–100) most of the occupied day; keep CO2 ≤ 1,000 ppm (24‑h) and PM2.5 within WHO guidelines where feasible. Use demand‑controlled ventilation, MERV‑13+ filtration, and cooking/printing source controls.
Each pollutant is mapped to an index via breakpoints, using linear interpolation (the ‘ratio’ method). IAQI uses a 1‑minute average to catch rapid indoor spikes (e.g., cooking). The final IAQI equals the lowest (most limiting) sub‑index.
Why this approach? It mirrors how the outdoor AQI highlights the pollutant posing the greatest acute risk at that moment while tuning the averaging time for indoor decision-making.
Cooking, poorly vented combustion, and product off‑gassing often drive IAQI down. Focus on capture ventilation, low‑emitting products, and filtration.
Instead of parsing through fragmented data from individual pollutants like Particulate Matter or Volatile Organic Compounds, the IAQI provides a quick snapshot of overall air quality. This unified metric simplifies monitoring across various settings, from schools to offices and homes, turning complex data into a clear and actionable metric and promoting healthier indoor spaces. Here are some advantages of IAQI:
Unlike individual pollutant readings, the IAQI amalgamates data from various sources, providing a comprehensive snapshot of overall indoor air quality.
Prompt Actions: This rapid assessment capability of the IAQI ensures timely interventions. For instance:
Informed Decisions: The simplified metric of the IAQI empowers individuals and institutions to make informed choices about indoor environments without the complications of tracking individual pollutants.
***

Atmocube is a RESET Air Accredited Grade B monitor providing continuous real-time air quality data.
It measures the following parameters:
Treat IAQI as a dashboard light: it warns you fast, but the fix comes from source control, ventilation, and filtration. Track CO2, PM2.5, and TVOC; test for radon; and use HEPA/MERV‑13+ to keep air clean.
A single score summarizing multiple indoor pollutants (higher = better on Atmotube’s IAQI). It’s a decision aid, not a regulatory standard.
AQI is for outdoor air with 1–24‑hour averages; IAQI is minute‑by‑minute indoors and includes metrics like CO2/TVOC.
Sub‑indices from pollutant breakpoints via linear interpolation; the final score is the lowest sub‑index.
PM2.5 (optical), CO2 (NDIR), TVOC/formaldehyde (gas sensors), plus temperature and humidity.
Aim for Good (81–100) most of the time in occupied rooms.
Five levels: Good (81–100), Moderate (61–80), Polluted (41–60), Very Polluted (21–40), and Severely Polluted (0–20).
CO2 tracks ventilation; keep near or below 1,000 ppm (24‑h) in homes/schools when feasible.
Pick devices with transparent methods and evaluation data; see the EPA Air Sensor Toolbox for performance guidance.
Source control → ventilate with clean outdoor air → filter (HEPA/MERV‑13+); avoid ozone generators.
Target Good most of the day; keep CO2 ≤ 1,000 ppm and PM2.5 within WHO guidelines where feasible.
