
What 38 Community Scientists Found in America's Most Polluted ZIP Code
A peer-reviewed CU Boulder study on how personal air monitoring changed what residents of four Denver neighborhoods understood about their air — and what they did about it.

Off-Gassing in Your New Home: What It Is and How to Stay Safe
Concerned about indoor air quality due to off-gassing? Learn simple steps to reduce VOCs and improve your home's air quality.

Indoor Air Quality Index (IAQI): Standards and Metrics
Learn how the Indoor Air Quality Index (IAQI) transforms real-time air quality data into actionable insights. Discover its methodology, categories, and practical applications.

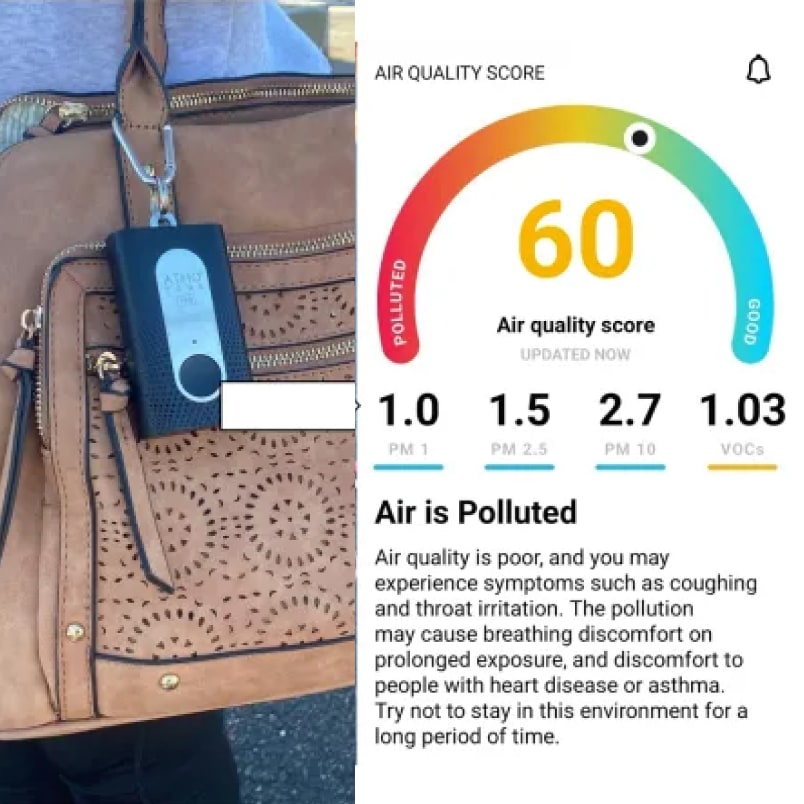
What is Air Quality Score (AQS)?
Learn how Atmotube's Air Quality Score (AQS) provides instant insights into air quality, ranging from 0 (severely polluted) to 100 (very clean).

What is Particulate Matter? Types of Particulate Matter
Discover the health impacts of Particulate Matter (PM) and its different size categories—PM10, PM2.5, and PM1. Learn about their sources, risks, and how they affect air quality.

TVOC: Standards for Indoor Air Quality (IAQ)
Discover key TVOC indoor air quality rating systems, including German IAQ levels, WHO guidelines, RESET standards, and LEED certification.

Integrating an Air Quality Monitor with Home Assistant via MQTT
Learn how to integrate Atmocube with Home Assistant via MQTT, set up real-time air quality monitoring, and automate CO2 alerts with this step-by-step guide.

What Are VOCs?
Track indoor air quality with Atmotube’s VOC sensor. Identify harmful volatile organic compounds (VOCs) and maintain a healthier environment at home or in the workplace.

Raising Air Pollution Awareness in Kenya: Interview with Dr. Malkia Abuga
We interviewed Malkia Abuga, a public health professional from Nairobi County, about the air pollution problem in Kenya and raising community awareness.

Atmocube Receives the Works with WELL Mark
Atmocube, ATMO®'s commercial IAQ monitor, has earned the Work with WELL mark from the International WELL Building Institute (IWBI).
.png)
VOC Concentration in Air (Units of Measurement)
Learn how to convert air pollutant concentrations between ppm, ppb, mg/m³, and μg/m³ using molecular weight, temperature, and pressure assumptions. Example calculation included for

Particulate Matter (PM) levels and AQI
Learn how air quality indices (AQI) help communicate pollution levels worldwide. Explore regional AQI systems like EAQI (Europe) and the EPA's AQI (U.S.).